home
***
CD-ROM
|
disk
|
FTP
|
other
***
search
/
PDR Electronic Library 2001 2AX
/
PDR Electronic Library 2001 2AX.iso
/
Data
/
Pdr
/
Images
/
70
/
86007503.JPG
< prev
next >
Tile
Joint Photographic Experts Group Image
|
2001-05-31
|
35.9 KB
|
480x524
|
8-bit (256 colors)
similar images
ocr:
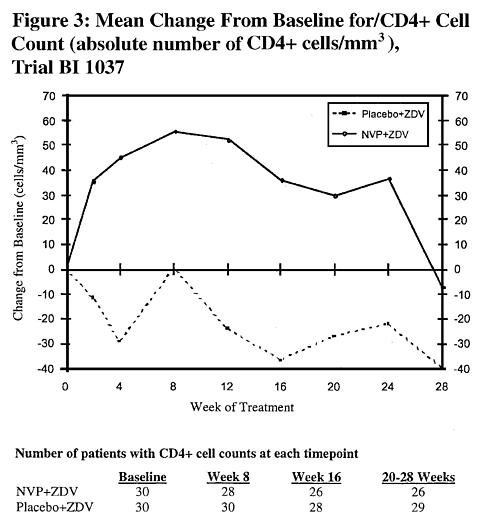
Figure 3: Mean Change From Baseline for/CD4+ Cell Count (absolute number of CD4+ cells/mm'), Trial BI 1037 70 70 F Placebo*ZDV 60 60 NVP+ZDV 50 50 40 40 30 30 20 20 10 10 0 - 9 -10 -10 -20 -20 -30 -30 -40 -40 8 12 16 20 24 28 Week ofTreatment Number of patients with CD4+ cell counts at each timepoint Baseline Week 8 Week 16 20-28 Weeks NVP+ZDV 30 28 26 26 Placebo+ZDV 30 30 28 29